Integrating Tracing in Azure NodeJS Applications
This guide covers the integration of Azure services with OpenTelemetry (OT) for tracing NodeJS applications, along with benchmarking and performance insights.
Azure and OpenTelemetry
Microsoft is rapidly adopting OpenTelemetry (OT) as the standard for tracing, migrating from older custom solutions (e.g., vendor protocols for Application Insights).
OpenTelemetry (OT) is an open-source framework for collecting monitoring and telemetry data, including traces, metrics, and logs, from software applications to improve observability and debugging.
The OT ecosystem for NodeJS consists of vendor-neutral libraries that enable a NodeJS process (whether on Azure or AWS) to send metrics to an OT "collector":
open-telemetry/opentelemetry-js: OpenTelemetry JavaScript Client
In the specific case of Azure, the collector is Azure Monitor.
The reference OT package for NodeJS in the Azure ecosystem is
@azure/monitor-opentelemetry,
which exports a method useAzureMonitor that enables the necessary
instrumentation for popular libraries (such as http, redis, mysql,
postgresql, etc.), so metrics can be transparently traced for users of
different SDK clients.
OT instrumentation is implemented through runtime patching of the client SDK
calls. Therefore, you need to import the necessary libraries
(@azure/monitor-opentelemetry) and call the useAzureMonitor method before
including any other package in the codebase.
Patching native NodeJS fetch
The @azure/monitor-opentelemetry package does not patch the native fetch
method by default, which is commonly used in modern NodeJS applications.
At the time of writing this document, instrumenting the native fetch of NodeJS
(based on the undici package) requires an additional step on top of using the
useAzureMonitor method:
Monitor OpenTelemetry - Add native fetch instrumentation
See Example Integration with App Service for a complete example.
If you are using version 2.x of the Application Insights SDK, be aware that it does not support instrumentation of the native fetch methods so external HTTP requests will not be traced unless you use some custom fetch wrapper.
This is a further reason to migrate to the new version of the SDK (3.x) or to
use the @azure/monitor-opentelemetry package.
Instrument ESM applications
Currently, there are some challenges with instrumenting ESM applications. While the basic configuration enables data flow to Application Insights (visible on the Azure Portal), end-to-end correlation does not function as expected.
Instrumentation of ESM modules is still experimental
and may not be as seamless as transpiling TypeScript to CommonJS modules.
Inspired by a GitHub issue addressing a similar problem,
there is an alternative method to instrument the @azure/monitor-opentelemetry
package.
Steps to Instrument an ESM Application
- Create a new
.mjsfile, you can call itinstrumentation.mjsfor example - Add the following code to the beginning of the file:
import { createAddHookMessageChannel } from "import-in-the-middle";
import { register } from "module";

const { registerOptions, waitForAllMessagesAcknowledged } =
  createAddHookMessageChannel();

register("import-in-the-middle/hook.mjs", import.meta.url, registerOptions);
- Set up the instrumentation SDK you want to use:
useAzureMonitor();
or in case you want to use the applicationinsights SDK:
appInsights.setup().start();
This basic setup for both @azure/monitor-opentelemetry and
applicationinsights SDKs is enough to start sending telemetry data to Azure
Monitor assuming the environment variable
APPLICATIONINSIGHTS_CONNECTION_STRING is set up correctly.
- Import the necessary instrumentations and register them
// If necessary, add other instrumentations, like the undici one
registerInstrumentations({
  instrumentations: [instrumentAzureFunctions(), new UndiciInstrumentation()],
  meterProvider: metrics.getMeterProvider(),
  tracerProvider: trace.getTracerProvider(),
});
- At the end of the file, add the following code:
await waitForAllMessagesAcknowledged();
By following these steps, you can configure the @azure/monitor-opentelemetry
or applicationinsights package along with other instrumentations in an ESM
application.
Running the Instrumented Application
To ensure the instrumentation works correctly, you need to import the
instrumentation.mjs file when running the application by using the
NODE_OPTIONS environment variable:
"NODE_OPTIONS": "--import ./dist/instrumentation.mjs",
Ensure you use the correct path to the instrumentation.mjs file, as it may
vary depending on your project structure.
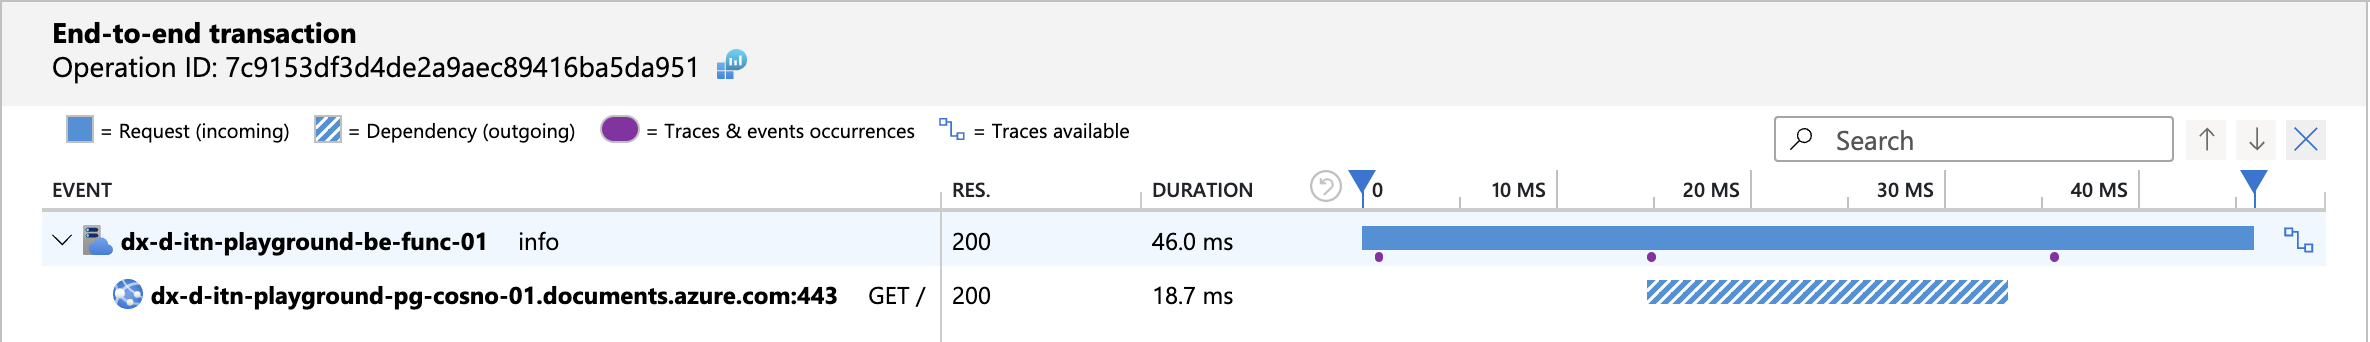
After setting everything up and running your application, you will see telemetry data in Azure Monitor with service correlation:
Using the Application Insights SDK
The latest version of the Application Insights SDK (3.x) is essentially a
wrapper around OT functionalities provided by the @azure/monitor-opentelemetry
package:
microsoft/ApplicationInsights-node.js: Microsoft Application Insights SDK for Node.js
The new AI SDK uses the @azure/monitor-opentelemetry package under the hood:
the useAzureMonitor method is called at the bootstrap of the application to
enable tracing and metrics.
Moreover, the SDK provides a series of
"shims"
that enable its adoption in legacy applications using tracing methods from
previous versions (e.g., trackEvent) without refactoring the existing code.
Although you can enable tracing and metrics using only the
@azure/monitor-opentelemetry package, if you want to use legacy AI methods
(e.g., trackEvent), you must use the AI SDK and call the setup and
start methods at the bootstrap of the application to initialize the default
TelemetryClient.
Alternatively, you can use only @azure/monitor-opentelemetry to send custom
events. To achieve this, ensure you are using version
1.0.0-beta.29
or later of the @azure/monitor-opentelemetry-exporter.
import { useAzureMonitor } from "@azure/monitor-opentelemetry";
import { logs } from "@opentelemetry/api-logs";

useAzureMonitor(/* Add your Azure Monitor options here */);

// ...

// The logger name can be any string and is used to identify the logger
// within log processors. This allows different processing rules to be applied,
// enabling custom settings for sampling and log levels.

// The AI SDK uses "ApplicationInsightsLogger" as the default logger name.
// Refer to the source code here:
// https://github.com/microsoft/ApplicationInsights-node.js/blob/03c380558f15fd46c20ba90de343e8d427f1be30/src/main.ts#L39
// It is not mandatory to use the same name. However, if you do, the logger
// will inherit the same configuration settings as the AI SDK.

logs.getLogger("ApplicationInsightsLogger").emit({
  attributes: {
    "microsoft.custom_event.name": "my-custom-event",
    "foo": "bar",
    ... // other custom attributes
  },
});
When evalutating to chose between the AI SDK and the Azure Monitor package,
consider that the AI SDK may fall behind new versions of
@azure/monitor-opentelemetry, so going with the latter may be more
future-proof. The AI SDK is still advantageous if you need to use legacy AI
methods.
Enabling HTTP KeepAlive
Unlike previous versions, HTTP KeepAlive is enabled by default in all modern Azure SDKs, and there is no longer a need to set up a custom agent.
azure-sdk-for-js/sdk/core/core-rest-pipeline/src/pipelineRequest.ts
Setting Sample Rate in AI SDK
When using the AI SDK, it's a good practice to limit the number of traces sent to Application Insights by setting the sample rate.
The sample rate can be set in different ways.
Using the applicationinsights.json configuration file
See https://github.com/microsoft/ApplicationInsights-node.js?tab=readme-ov-file#configuration
{
  "samplingPercentage": 30
}
Using the APPLICATIONINSIGHTS_CONFIGURATION_CONTENT environment variable
This environment variable takes precedence over the applicationinsights.json
and has the same format as the JSON file.
process.env["APPLICATIONINSIGHTS_CONFIGURATION_CONTENT"] =
  process.env["APPLICATIONINSIGHTS_CONFIGURATION_CONTENT"] ??
  JSON.stringify({
    samplingPercentage: 5,
  } satisfies Partial<IJsonConfig>);
Set sample rate programmatically
import * as ai from "applicationinsights";

ai.setup();
ai.defaultClient.config.samplingPercentage = 5;
ai.start();
Enable sampling of traces and custom events with OpenTelemetry
OpenTelemetry uses Tracer and Loggers for different types of telemetry data:
- traces: Used for traces (HTTP requests and other external calls) and metrics.
- logs: Used for console logs and custom events.
By design OpenTelemetry SDKs sample only traces but not logs.
In the context of Application Insights, the terminology differs:
- traces: Correspond to logs emitted by the application using
console.log(orcontext.login Azure Functions) and custom events. - dependencies: Correspond to Opentelemetry traces.
To enable parent based sampling for logs and custom events, you can set
the following option when initializing the AI SDK before calling ai.start():
ai.defaultClient.config.azureMonitorOpenTelemetryOptions = {
  enableTraceBasedSamplingForLogs: true,
};
This setting will ensure that logs and custom events are sampled based on the parent trace context. Without this setting, logs and custom events will always be forwarded at a 100% sample rate.
Check if sampling is enabled
To check if sampling is enabled, you can use the following query in Log Analytics:
union requests,dependencies,pageViews,browserTimings,exceptions,traces,customEvents
| where timestamp > ago(1h)
| summarize RetainedPercentage = 100/avg(itemCount) by bin(timestamp, 1m), itemType, sdkVersion
Of course, you need to add a filter for the Azure Function or App Service instance you are interested in.
If you see values < 100 then sampling is enabled for that item type.
Integration with App Services
Both Azure Functions and App Services (NodeJS) allow integration with Application Insights without using the SDK. This integration is active in the following scenarios:
- The legacy environment variable APPINSIGHTS_INSTRUMENTATIONKEY is set.
- The environment variable APPLICATIONINSIGHTS_CONNECTION_STRING is set.
When either of these variables is set, the NodeJS application incorporates a custom AI agent that starts at bootstrap before importing any other module.
On App Services, this mechanism interferes with the programmatic setup of the AI SDK, overwriting its settings. Therefore, it is recommended to disable the default integration by removing these environment variables whether you are using the AI SDK programmatically.
When using the AI SDK, check that the default AI integration is disabled by
ensuring that the APPINSIGHTS_INSTRUMENTATIONKEY and
APPLICATIONINSIGHTS_CONNECTION_STRING variables are not set. It is recommended
to use a custom environment variable that will be configured in the
useAzureMonitor and/or ai.setup settings.
To verify that the default integration is indeed disabled, navigate to the "Application Insights" panel of the App Service on the Azure portal.
At the time of writing, the default integration (agent) does not support end-to-end tracing which can be achieved only by using the AI SDK 3.x programmatically.
Integration with Next.js Deployed on Azure App Service
For Next.js applications deployed on App Service, similar considerations
apply. However, since there is no single entry point as with other frameworks,
you must use the instrumentation module. This module is loaded first by
Next.js to ensure that Application Insights/OpenTelemetry is initialized
before anything else:
Integration with Azure Functions
Azure Functions are a bit more complex to integrate with OpenTelemetry since you have to handle it both in the Azure Functions runtime (host) and in the application code (worker).
End-to-End tracing with host AI integration enabled
The Azure Functions runtime (host) activates monitoring when the
APPLICATIONINSIGHTS_CONNECTION_STRING is set.
At the time of writing, only when activating OpenTelemetry
("telemetryMode": "OpenTelemetry" in host.json), the Azure Functions
runtime produces extraneous traces that are not part of the application code.
This behavior is expected to be fixed in the future:
https://github.com/Azure/azure-functions-host/issues/10770#issuecomment-2627874412
In both configurations (OpenTelemetry enabled or disabled), when using the AI 3.x SDK, you get end-to-end tracing of the application code (worker). Next step is align sample rate in AI SDK and Azure Functions runtime.
Azure Function OpenTelemetry Instrumentation
To enable end-to-end tracing in Azure Functions with OpenTelemetry, you need to add the related instrumentation to the worker code:
https://github.com/Azure/azure-functions-nodejs-opentelemetry
This instrumentation uses the Azure Function runtime (host) telemetry context to propagate it to the worker code. If you don't use this instrumentation, worker traces will not be linked to the incoming HTTP request.
At the time of writing, there is no way to disable verbose logging when using this package:
https://github.com/Azure/azure-functions-nodejs-opentelemetry/issues/8
Until this issue is resolved, it is recommended to extract and use only the part that enables end-to-end tracing.
See Code Snippets for the hook implementation that enables end-to-end tracing in Azure Functions.
Align Sample Rate in AI SDK and Azure Functions Runtime
AI SDK use a fixed sample rate, while the Azure Functions runtime (host) uses an adaptive sampling mechanism. To minimize discrepancies in the number of traces recorded, it is recommended to align the sample rate in the AI SDK with the Azure Functions runtime.
To align the sample rate in the Azure Functions runtime with the AI SDK, you can
set these options in host.json to the same value used programmatically:
{
  "logging": {
    "applicationInsights": {
      "samplingSettings": {
        "minSamplingPercentage": 5,
        "maxSamplingPercentage": 5,
        "initialSamplingPercentage": 5
      }
    }
  }
}
Alternatively, you may use the following environment variables for the same purpose:
AzureFunctionsJobHost__logging__applicationInsights__samplingSettings__minSamplingPercentage=5
AzureFunctionsJobHost__logging__applicationInsights__samplingSettings__maxSamplingPercentage=5
AzureFunctionsJobHost__logging__applicationInsights__samplingSettings__initialSamplingPercentage=5
Beware that the runtime also relies on the
AzureFunctionsJobHost__logging__applicationInsights__samplingSettings_maxTelemetryItemsPerSecond
variable to limit the number of traces sent, so perfect alignment cannot be
guaranteed.
Configuring log levels for the Azure Functions runtime
The Azure Functions runtime (host) allows you to configure log levels for
different categories of logs. This configuration can be set in host.json or
using environment variables.
For example, to set the log level for Function category to Information:
{
  "logging": {
    "logLevel": {
      "Function": "Information"
    }
  }
}
To set the same log level using environment variables instead:
AzureFunctionsJobHost__logging__logLevel__Function=Information
The latter approach is useful when you want to override the log level at runtime without redeploying the function app.
Setting the log level for the Function category to Information will generate
two traces for each function execution (e.g.,
Executed 'Functions.redis-fetch' (Succeeded, Id=d555444c-a409-4932-86a8-8c84d3777ba8, Duration=184ms)).
While this can be useful for debugging and monitoring, it is not recommended for
production as it can produce a large number of traces. Note that setting this
value to Warning or higher will prevent context.log and context.info
messages from being recorded in Application Insights. This is considered a
reasonable trade-off since critical logs can still be captured using
context.warning or context.error, and the Information level can be enabled
for debugging purposes when needed.
The suggested approach is to set the default log level to Warning or higher in
production and use the AI SDK for custom events and logging:
{
  "logging": {
    "logLevel": {
      "default": "Warning",
      "Host.Results": "Information",
      "Host.Aggregator": "Information"
    }
  }
}
This setup will ensure that only critical logs are recorded in Application Insights, while the AI SDK can be used for custom events and to trace exceptions and warnings.
Moreover we keep the Host.Results and Host.Aggregator categories at
Information to capture HTTP requests, function execution results and counters,
useful for monitoring and alerting.
If capturing context.info or context.log is essential, you can set the log
level for the specific Function category to Information:
{
  "logging": {
    "logLevel": {
      "Function.MyFunctionName.User": "Information"
    }
  }
}
Moreover, only for local debugging, you can set
{
  "logging": {
    "logLevel": {
      "Host.Function.Console": "Information"
    }
  }
}
This will capture all console.log messages locally, but they won't be sent to
Application Insights in production.
Refer to https://github.com/anthonychu/functions-log-suppression for more details.
Sampling gotchas within Azure Functions
- Beware that
traces(logs) andcustomEventsemitted by the AI SDK are not sampled. This implies that even if you configure a sample rate of 5% in the AI SDK, you will still see 100% oftracesandcustomEvents. - When using
"telemetryMode": "OpenTelemetry"inhost.json, it appears that there is no way to enable sampling at all for the host yet: https://github.com/Azure/azure-functions-host/issues/10770#issuecomment-2629318006 - If you want to override
logLevelsusing environment variables, beware that "App settings that contain a period aren't supported when running on Linux in an Elastic Premium plan or a Dedicated (App Service) plan", see https://learn.microsoft.com/en-us/azure/azure-functions/configure-monitoring?tabs=v2#overriding-monitoring-configuration-at-runtime
End-to-End tracing with host AI integration disabled
If you choose to disable the default AI integration and rely solely on the AI
SDK (using a variable other than APPLICATIONINSIGHTS_CONNECTION_STRING), you
will lose end-to-end tracing of the application code (worker) because the
runtime (host) will no longer record HTTP requests.
To achieve full integration and enable end-to-end tracing of calls in this scenario, you need to incorporate a wrapper around the Functions' handlers that programmatically activates the OpenTelemetry mechanisms.
Benchmarks have shown that this wrapper does not introduce any significant performance penalties, so you can safely use it in production.
Setting Cloud Role Name
When using the AI SDK, the cloudRoleName is set by default to the name of the
App Service or Azure Function. This value is used to identify the
service in Application Insights and group traces.
If you need to customize the cloudRoleName (the name of the service in
Application Insights), you can set the OTEL_SERVICE_NAME environment.
Setting a value for
ai.defaultClient.context.tags[ai.defaultClient.context.keys.cloudRole]
produces no result, even though some online tutorials suggest it. These
tutorials are now considered obsolete.
Sampling and Performance
Load tests were performed on App Service and Azure Functions, with the following conditions:
- AI completely disabled.
- AI enabled with sampling at 0%.
- AI enabled with sampling at 50%.
- AI enabled with sampling at 100%.
Benchmark on App Service
The test was conducted using Azure Load Test on a test App Service (B1) for 5 minutes with an average of 200 requests per second. There was a maximum overhead of 30ms observed between tests with 100% sampling compared to those with AI disabled.
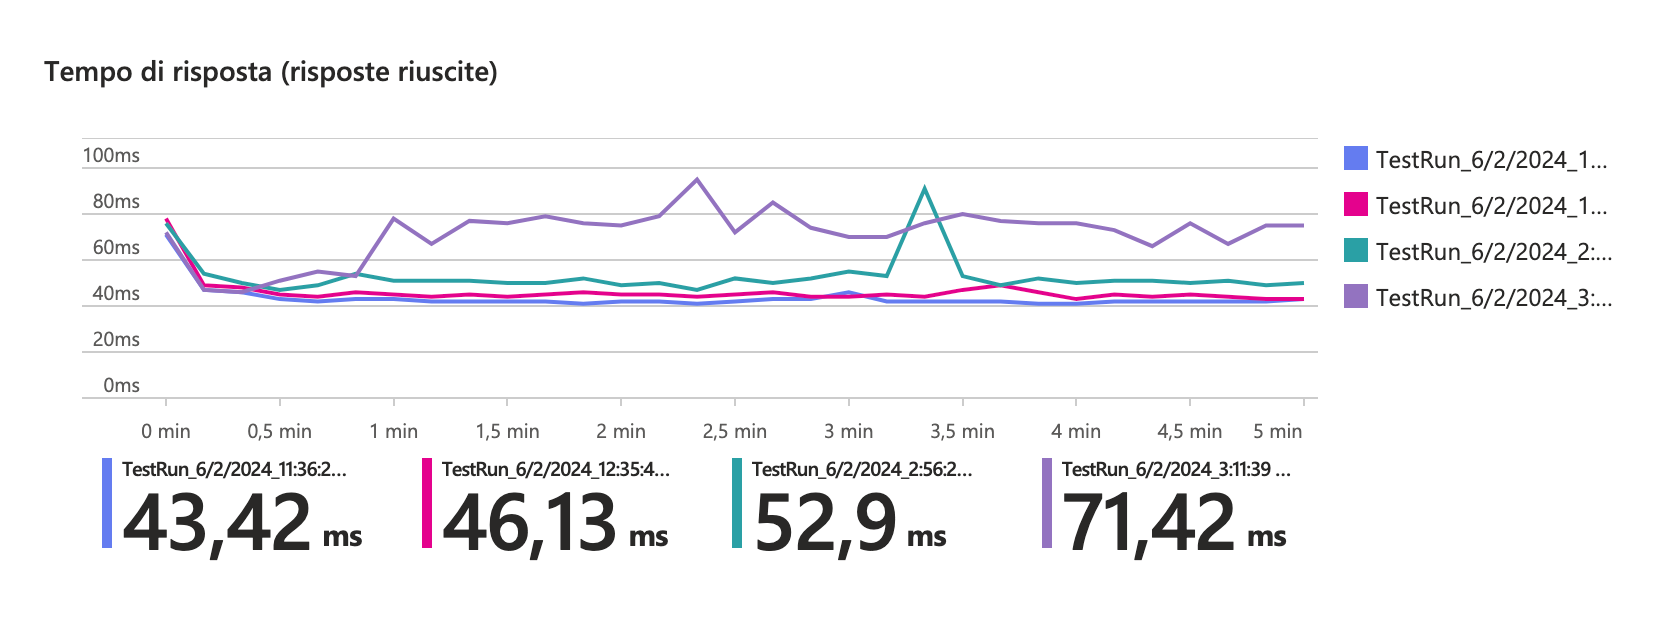
Using a sampling level < 30% introduces negligible overhead with AI enabled via SDK
Benchmark on Azure Functions
The test was conducted on an Azure Function using the Y1 consumption plan for 5 minutes with an average of 200 requests per second. Once the instances had scaled, a maximum overhead of 60ms was observed between tests with 100% sampling and those with AI disabled.
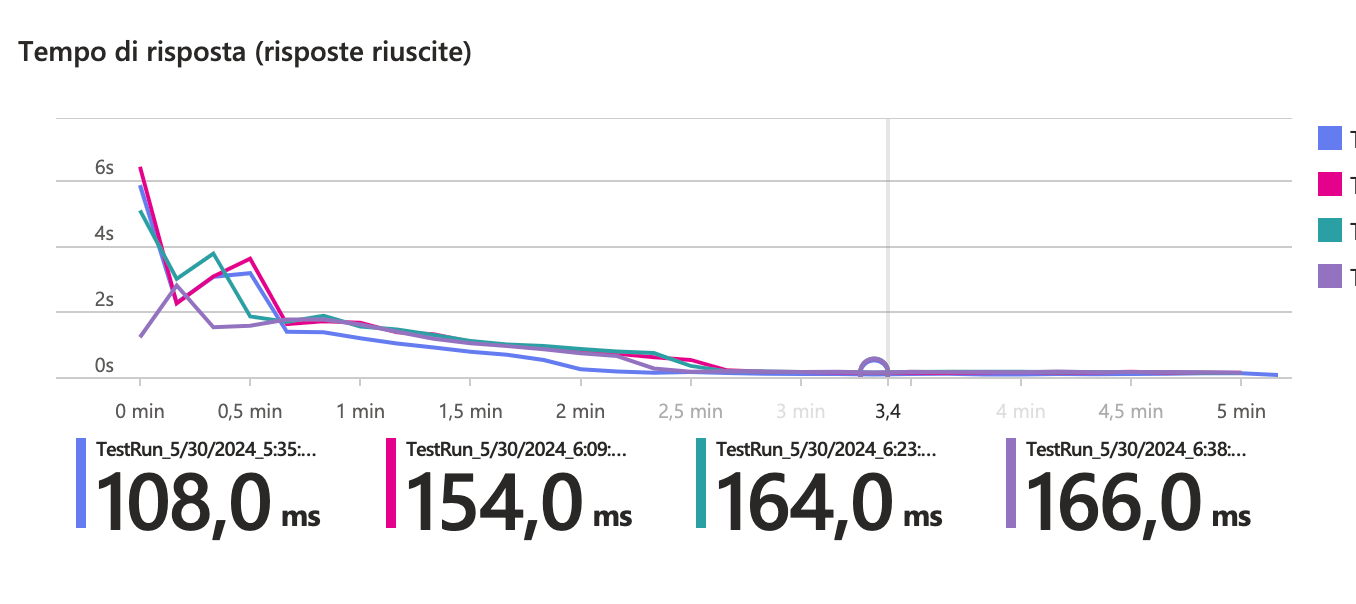
It seems that the sampling value had less impact on time differences once the instances had scaled horizontally. However, the time needed for scaling increased linearly with the sampling values.
Key Takeaways
- It is recommended to start migrating logging and metric tracing procedures to OpenTelemetry, incorporating the new version of the AI SDK 3.x.
- Adopting OT is currently the only method for achieving end-to-end tracing, including the tracing of native NodeJS fetch requests.
- It is advisable to disable the default integrations and use the SDK programmatically on App Services.
- The current OT implementation on Azure Functions is still unstable;
monitor progress and avoid using
"telemetryMode": "OpenTelemetry"in host.json until issues are solved.
Code Snippets
Example Integration with App Service
import * as ai from "applicationinsights";

import { UndiciInstrumentation } from "@opentelemetry/instrumentation-undici";
import { registerInstrumentations } from "@opentelemetry/instrumentation";
import { metrics, trace } from "@opentelemetry/api";
import { IJsonConfig } from "applicationinsights/out/src/shim/types";

// setup sampling percentage from environment (optional)
// see https://github.com/microsoft/ApplicationInsights-node.js?tab=readme-ov-file#configuration
// for other options. environment variable is in JSON format and takes
// precedence over applicationinsights.json
process.env["APPLICATIONINSIGHTS_CONFIGURATION_CONTENT"] =
  process.env["APPLICATIONINSIGHTS_CONFIGURATION_CONTENT"] ??
  JSON.stringify({
    samplingPercentage: 30,
  } satisfies Partial<IJsonConfig>);

// setup cloudRoleName (optional)
process.env.OTEL_SERVICE_NAME =
  process.env.WEBSITE_SITE_NAME ?? "local-app-service";

ai.setup(process.env["AI_SDK_CONNECTION_STRING"]).start();

// this must be called _after_ starting the AI SDK
// in order to instantiate the OTEL tracer provider
registerInstrumentations({
  tracerProvider: trace.getTracerProvider(),
  meterProvider: metrics.getMeterProvider(),
  // instrument native node fetch
  instrumentations: [new UndiciInstrumentation({
    requestHook: (span, requestInfo) => {
      const { origin, method, path } = requestInfo;
      // Default instrumented attributes don't feed well into AppInsights,
      // so we set them manually.
      span.setAttributes({
        "http.url": `${origin}${path}`,
        "http.method": method,
        "http.target": path,
        "http.host": origin,
      });
    },
    responseHook: (span, { response }) => {
      // Same as above, set the status code manually.
      span.setAttribute("http.status_code", response.statusCode);
    },
  })],
});
//
// Only when using Azure Function uncommented the code below
//
//  import { app } from "@azure/functions";
//  import { context as otelContext, propagation } from '@opentelemetry/api';
//
// app.hook.preInvocation((context) => {
//   const traceContext = context.invocationContext.traceContext;
//   if (traceContext) {
//     context.functionHandler = otelContext.bind(
//       propagation.extract(otelContext.active(), {
//         traceparent: traceContext.traceParent,
//         tracestate: traceContext.traceState,
//       }),
//       context.functionHandler,
//     );
//   }
// });
//
export default ai;
Example of OT Context wrapper for Azure Functions
import { HttpRequest, InvocationContext, HttpHandler } from "@azure/functions";
import {
  Attributes,
  SpanKind,
  SpanOptions,
  SpanStatusCode,
  TraceFlags,
  context,
  trace,
  Span,
  SpanContext,
} from "@opentelemetry/api";
import {
  SEMATTRS_HTTP_METHOD,
  SEMATTRS_HTTP_STATUS_CODE,
  SEMATTRS_HTTP_URL,
} from "@opentelemetry/semantic-conventions";

export default function withAppInsights(func: HttpHandler) {
  return async (req: HttpRequest, invocationContext: InvocationContext) => {
    if (
      process.env["DISABLE_FUNCTION_WRAPPER"]
    ) {
      return await func(req, invocationContext);
    }
    const startTime = Date.now();

    // Extract the trace context from the incoming request
    const traceParent = req.headers.get("traceparent");
    const parts = traceParent?.split("-");

    const parentSpanContext: SpanContext | null =
      parts &&
      parts.length === 4 &&
      parts[1].length === 32 &&
      parts[2].length === 16
        ? {
            traceId: parts[1],
            spanId: parts[2],
            traceFlags: TraceFlags.NONE,
          }
        : null;

    const activeContext = context.active();

    // Set span context as the parent context if any
    const parentContext = parentSpanContext
      ? trace.setSpanContext(activeContext, parentSpanContext)
      : activeContext;

    const attributes: Attributes = {
      [SEMATTRS_HTTP_METHOD]: "HTTP",
      [SEMATTRS_HTTP_URL]: req.url,
    };

    const options: SpanOptions = {
      kind: SpanKind.SERVER,
      attributes: attributes,
      startTime: startTime,
    };

    // Emulates an HTTP request span
    const span: Span = trace
      .getTracer("ApplicationInsightsTracer")
      .startSpan(`${req.method} ${req.url}`, options, parentContext);

    let res;
    try {
      res = await context.with(trace.setSpan(activeContext, span), async () => {
        return await func(req, invocationContext);
      });
      const status = res?.status;
      if (status) {
        span.setStatus({
          code: status < 400 ? SpanStatusCode.OK : SpanStatusCode.ERROR,
        });
        span.setAttribute(SEMATTRS_HTTP_STATUS_CODE, status);
      }
    } catch (error) {
      span.setStatus({
        code: SpanStatusCode.ERROR,
        message: error instanceof Error ? error.message : JSON.stringify(error),
      });
      throw error;
    } finally {
      span.end(Date.now());
    }

    return res;
  };
}
app.http("root", {
  route: "/",
  methods: ["GET"],
  authLevel: "anonymous",
  handler: withAppInsights(async (req) => ({
    body: `Hello, ${req.query.get("name")}!`,
  })),
});